Design1 min reading time
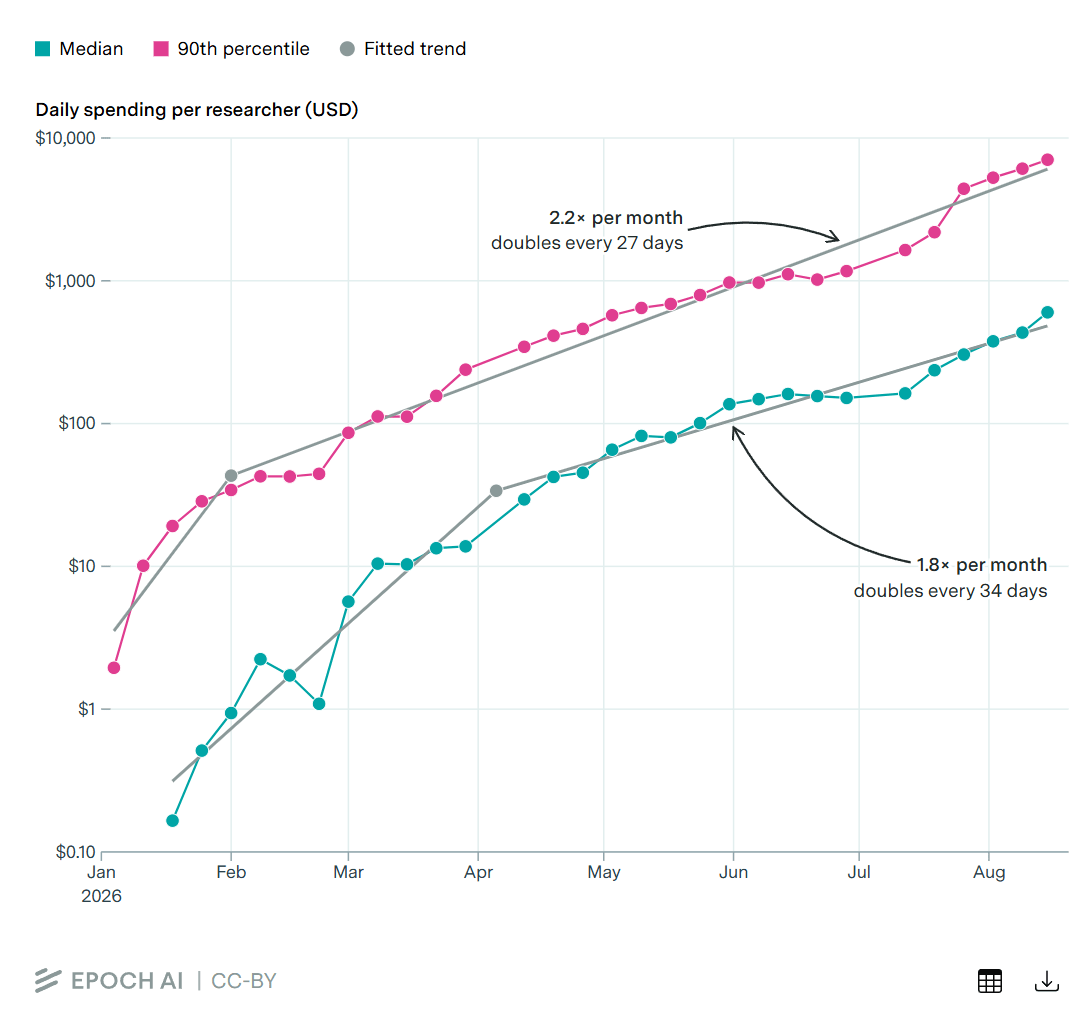
"Holy shit" graphs and how to get more of them
LessWrong
Read the full articleThe article explores the concept of "holy shit" graphs—data visualizations that reveal surprising and insightful patterns—and discusses strategies to create more of these impactful graphs to enhance understanding and decision-making.